
The Full Simulation
Comparing Electoral Systems
Question: Which of these Four (4) Electoral Systems are best at Uniformly Balancing the Interests of the voters?
Test Your Knowledge
This page and its videos include a quiz you can take to test your understanding. This lesson is part of a larger education series.
The Test
What the Simulation Measures
Fair representation means three things — how people vote, who wins the seats, and who runs the committees. Every system below is judged on all three.
Vote Share
The interests of individuals in jurisdictions are multifaceted and subject to change. The selection mechanism for their representatives should distort this diversity of interests as little as possible to minimize consent violations and balance interests uniformly.
Seat Control
the allocation of seats in the governing body based on the vote share. It should mirror the vote share proportionally to ensure that the governing body accurately represents the preferences of the electorate. This alignment prevents any distortion of the people's will.
Committee Control
Seats within committees are distributed among factions. Like Seat Control, Committee Control aims to proportionally reflect the vote share within the committees, which are crucial for detailed legislative work. Proper Committee Control ensures that the influence within committees matches the factions' electoral support, maintaining balanced decision-making across all governance levels.
One Electorate, Four Systems
Every system below is tested against the very same set of voters — the sample electorate shown here. Only the counting rules change.
The Field
The Four Contenders
Four ways to turn the same votes into a government. Here is each in one line — then we run all four, step by step.
Autocratic Voting
The Prevailing Power Structure controls who can stand for election and who can vote. Additional obstacles to suppress opposition are implemented by the power structure to maintain the status quo.
Plurality Voting (FPTP)
Plurality Voting, also known as First Past the Post Voting, is a method where the option selected with the most votes win.
Ranked Choice Voting (RCV)
Voters rank their candidates putting a 1 next to their first choice, 2 next to their 2nd choice and so on. If the voters preferred candidate is eliminated, their votes are distributed to the remaining preferred candidates.
Proportional Ranked Choice Voting (PR-RCV)
PR-RCV is similar to RCV except there are multiple winners. This can be accomplished by increasing the number of winners per district OR by combining several districts into one larger district.
System 1
Autocratic Voting
The prevailing power structure controls who may run and who may vote. Every real challenger is disqualified before the ballot.
Appoint a Leader
In an autocracy a single power structure decides. The struck-through factions are disqualified before any vote.
| Leader Appointment |
|---|
The Candidates
Only the incumbent F (Green) is allowed to win; real rivals are ruled out first.
| Candidate | Faction | Count | Vote Share |
|---|---|---|---|
| A | 🟥 Red | 50,000 | 5% |
| B | 🟧 Orange | 250,000 | 25% |
| D | 🟨 Yellow | 200,000 | 20% |
| F | 🟩 Green | 120,000 | 12% |
| G | 🟦 Blue | 300,000 | 30% |
| J | 🟪 Purple | 80,000 | 8% |
Vote Share
In this example B🟧(Orange) , D🟨(Yellow) , and G🟦(Blue) are disqualified as they are a threat to the incumbency of F🟩(Green) .
Outcome
The remaining candidates follow Plurality voting. All viable challengers have been removed with only fringe token opposition candidates remaining.
Seat Control
As a result, F🟩(Green) continues to stay in power.
Committee Control
Holding every seat, one faction controls every committee too — no rival voice remains.
Suppression of Free Speech & Information
Ensures only positive messages about the status quo are permitted and minority groups are branded enemies if they petition for equal treatment under the law.
Suppression of the Right to Vote
Uses the rule of law to justify taking rights away from criminals then is incentivized to make things crimes for the purpose of maintaining power and suppressing dissent. Forced labor classes and an industry to manage them emerge.
The Rulers Are Not Subject to the Ruled
There is no incentive to invest in the individuals ruled and the ruling body rules through fear and force. This depresses voter turnout and leads to increased levels of disengagement.
System 2
Plurality Voting (FPTP)
One vote each, one winner — even on a minority. Repeat it over cycles and it slides toward two parties, gerrymandering and suppression.
Cast Your Vote
Each voter picks one candidate; the front-runner wins — no majority required.
| Candidate Selection |
|---|
The Candidates
G (Blue) wins with just 30%; over 70% of voters elect no one.
| Candidate | Faction | Count | Vote Share |
|---|---|---|---|
| A | 🟥 Red | 50,000 | 5% |
| B | 🟧 Orange | 250,000 | 25% |
| D | 🟨 Yellow | 200,000 | 20% |
| F | 🟩 Green | 120,000 | 12% |
| G | 🟦 Blue | 300,000 | 30% |
| J | 🟪 Purple | 80,000 | 8% |
Vote Share
A Majority (over 50%) is NOT required to win in this system.
Outcome
Regardless of the number of options, the choice with the most votes prevails over all others even if the choice itself has non-majority support.
Seat Control
In this example G🟦(Blue) triumphs over 70% of voters with 30% support.
Committee Control
Winning the seat on a minority, one faction still takes full control of the committee.
1st Election Cycle
Blue🟦 wins with 30% of the vote, capitalizing on the divided opposition. In response, 🟨 Yellow decides to merge with Orange🟧 for the next election, aiming to strengthen their combined position.
| Faction | Count | Vote Share |
|---|---|---|
| 🟥 Red | 50,000 | 5% |
| 🟧 Orange | 250,000 | 25% |
| 🟨 Yellow | 200,000 | 20% |
| 🟩 Green | 120,000 | 12% |
| 🟦 Blue | 300,000 | 30% |
| 🟪 Purple | 80,000 | 8% |
2nd Election Cycle
In the second election, Orange🟧 wins with 45% of the vote, thanks to the support from 🟨 Yellow. In response, Blue🟦 and Purple🟪 consolidate with Green🟩for the next cycle, aiming to build a stronger coalition.
| Faction | Count | Vote Share |
|---|---|---|
| 🟥 Red | 50,000 | 5% |
| 🟧 Orange | 450,000 | 45% |
| 🟩 Green | 120,000 | 12% |
| 🟦 Blue | 300,000 | 30% |
| 🟪 Purple | 80,000 | 8% |
3rd Election Cycle
Orange🟧 loses with 45%, as Blue🟦 wins with 50%, leveraging the vote split caused by Red🟥. Following this, Red🟥 consolidates under Orange🟧, resulting in a two-party system in subsequent cycles.
| Faction | Count | Vote Share |
|---|---|---|
| 🟥 Red | 50,000 | 5% |
| 🟧 Orange | 450,000 | 45% |
| 🟦 Blue | 500,000 | 50% |
Fourth Election Cycle
| Faction | Count | Vote Share |
|---|---|---|
| 🟧 Orange | 510,000 | 49% |
| 🟦 Blue | 490,000 | 51% |
Fifth Election Cycle
| Faction | Count | Vote Share |
|---|---|---|
| 🟧 Orange | 490,000 | 49% |
| 🟦 Blue | 510,000 | 51% |
Alternate Voices Locked Out
Plurality voting makes it impossible for alternate voices to be heard by making less established factions unelectable.
| Faction | Count | Vote Share |
|---|---|---|
| 🟧 Orange | 500,000 | 50% |
| 🟦 Blue | 450,000 | 45% |
| 🟪 Purple | 50,000 | 5% |
Splitting the Vote Backfires
Every time a small party gains traction, the vote breaks in favor of the ideological opposite of the smaller party.
| Faction | Count | Vote Share |
|---|---|---|
| 🟧 Orange | 470,000 | 47% |
| 🟨 Yellow | 30,000 | 3% |
| 🟩 Green | 20,000 | 2% |
| 🟦 Blue | 480,000 | 48% |
Honest Voting Punished
Under Plurality Voting, voting for one’s actual interests is disincentivized.
| Faction | Count | Vote Share |
|---|---|---|
| 🟥 Red | 50,000 | 5% |
| 🟧 Orange | 450,000 | 45% |
| 🟦 Blue | 500,000 | 50% |
| Faction | Count | Vote Share |
|---|---|---|
| 🟧 Orange | 600,000 | 60% |
| 🟦 Blue | 400,000 | 40% |
Strategic Configuration 1
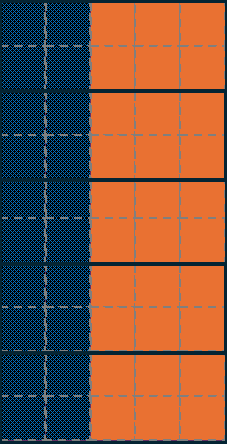
In this configuration, the districts are drawn in such a way that Orange🟧, despite having 60% of the vote, wins all 5 districts, effectively locking out Blue🟦 from representation entirely.
| 🟧 Orange | 🟦 Blue |
|---|---|
| 5 | 0 |
Strategic Configuration 2
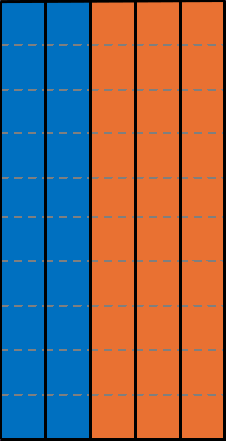
This configuration creates a slightly more balanced distribution, where Orange🟧 wins 3 districts and Blue🟦 wins 2. Here, the district lines are drawn to ensure that Orange🟧 retains a majority but allows some representation for Blue🟦.
| 🟧 Orange | 🟦 Blue |
|---|---|
| 3 | 2 |
Strategic Configuration 3
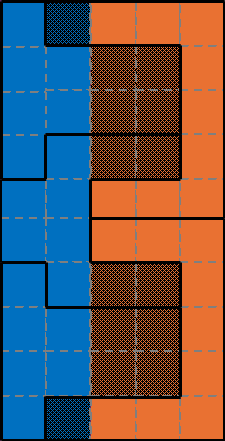
In this configuration, the districts are manipulated to favor Blue🟦 with 3 districts, while Orange🟧 wins only 2, despite Orange🟧 having a majority of the overall vote (60%). This is achieved by spreading Orange🟧 voters thinly across more districts while concentrating Blue🟦 voters in just enough districts to secure a win.
| 🟧 Orange | 🟦 Blue |
|---|---|
| 2 | 3 |
Defund Election Infrastructure
For the districts that are not predictable, or are predictably against the status quo, voting infrastructure can be removed, and barriers to voting and standing for office are put in place.
Target Rival Interests for Disenfranchisement
Target behaviors or attributes commonly associated with members of rival political blocks. Make it illegal and use it as a pretense to remove the right to vote.
Poll Taxes and Hidden Fees
Exploit Financial hardships in the most likely to be upset with the status quo to keep as many from voting as possible.
Non-Automatic Registration
Disenfranchisement via technical paperwork that need not exist in the first place.
Unsubsidized Identification Requirements
When combined with Registration Fees and Travel requirements, acquiring identification documents is a financial and time burden that applies disproportionately against those not benefiting in the status quo.
System 3
Ranked Choice Voting
Rank the field and transfer votes round by round until someone holds a majority. Better — but still one winner, still drifting to two parties.
Rank Your Choices
Rank the candidates in order. If your top choice is eliminated, your vote moves to your next choice.
| Rank | Candidate Selection |
|---|---|
| 1st Choice | |
| 2nd Choice | |
| 3rd Choice | |
| 4th Choice | |
| 5th Choice | |
| 6th Choice | |
The Candidates
The count runs in rounds until someone reaches a majority — here D (Yellow).
| Candidate | Faction | Votes | Share |
|---|---|---|---|
| D | 🟨 Yellow | 200,000 | (50%) |
| - F | - 🟩 Green | 110,000 | 11% |
| - J | - 🟪 Purple | 10,000 | 1% |
| - B | - 🟧 Orange | 160,000 | 16% |
| - A | - 🟥 Red | 20,000 | 2% |
| G | 🟦 Blue | 300,000 | (39%) |
| - J | - 🟪 Purple | 30,000 | 3% |
| - B | - 🟧 Orange | 50,000 | 5% |
| - A | - 🟥 Red | 10,000 | 1% |
| - | Dropped | 110,000 | 11% |
Vote Share
After voters rank their candidates, the candidate with the least votes is eliminated first and their voters 2nd choice votes are redistributed.
Outcome
Unlike Plurality Voting, Ranked Choice Voting gives voters alternative choices. However, as shown below, large percentages of the population are still locked out of government at any given time.
Seat Control
In this example, D🟨(Yellow) is aware that their victory was due in part to the support from F🟩(Green), J🟪(Purple), B🟧(Orange), and A🟥(Red).
Committee Control
Even with a broad coalition behind the winner, one faction still takes the single seat and its committee.
Follow the Votes — Round by Round
Step through each round and watch the ballots flow. Each band is colored by the party the votes came from; when a candidate is eliminated (greyed out) their ballots transfer to the next choice, until someone crosses the 50% majority and wins the single seat — marked with a gold medal.
Two Party Deadlock
Like in FPTP, under RCV Factions are forced to strategically vote to gain a competitive edge. However, unlike FPTP, the Spoiler Effect is not present.
| Faction | Count | Vote Share |
|---|---|---|
| 🟧 Orange | 510,000 | 49% |
| 🟦 Blue | 490,000 | 51% |
Strategic District Drawing
Because RCV also tends toward two parties, Power structures under RCV can draw electoral maps so that future election results are likely to favor the status quo.
| Faction | Count | Vote Share |
|---|---|---|
| 🟧 Orange | 600,000 | 60% |
| 🟦 Blue | 400,000 | 40% |
| 🟧 Orange | 🟦 Blue |
|---|---|
| 2 | 3 |
System 4
Proportional Ranked Choice Voting
Keep the ranked ballot, elect several winners at a fixed quota. Seats finally track the vote.
Rank the Full Field
Five seats are up, so rank as many as you like. A candidate wins at the 20% quota and surpluses transfer on.
| Rank | Candidate Selection |
|---|---|
| 1st Choice | |
| 2nd Choice | |
| 3rd Choice | |
| 4th Choice | |
| 5th Choice | |
| 6th Choice | |
| 7th Choice | |
| 8th Choice | |
| 9th Choice | |
| 10th Choice | |
The Sample Ballot
Five factions — B, D, F, G and J — each clear the quota. Almost every vote helps elect someone.
| Candidate | Faction | Count | Share |
|---|---|---|---|
| B | 🟧 Orange | 170,000 | (20%) |
| A | - 🟥 Red | 30,000 | 3% |
| D | 🟨 Yellow | 110,000 | (20%) |
| E | - 🟨 Yellow | 90,000 | 9% |
| F | 🟩 Green | 120,000 | (20%) |
| C | - 🟧 Orange | 70,000 | 7% |
| A | - 🟥 Red | 10,000 | 1% |
| G | 🟦 Blue | 200,000 | (20%) |
| J | 🟪 Purple | 80,000 | (15%) |
| I | - 🟦 Blue | 20,000 | 2% |
| G | - 🟦 Blue | 40,000 | 4% |
| H | - 🟦 Blue | 10,000 | 1% |
| · | Dropped | 50,000 | 5% |
Vote Share
For this Sample Ballot there are Five (5) seats available. Therefore, a Candidate must get 100% divided by 5 (or 20%) to win.
Outcome
The candidate with the least votes is eliminated first and their voters 2nd choice votes are redistributed.
Seat Control
This process repeats until all available seats have been filled or there are no candidates remaining.
Committee Control
In this Sample Ballot, B🟧(Orange), D🟨(Yellow), F🟩(Green), G🟦(Blue) , and J🟪(Purple) were able to get seats thanks in part to their primary supporters, and in part to supporters in different factions.
Follow the Votes — The Full Transfer Flow
Read left to right, one column per round. When a candidate reaches the 20% quota they win a seat — marked with a gold border and a numbered medal — and any surplus flows on; when a candidate is eliminated (greyed out) their votes flow to the next choice. Each band is colored by the party the votes came from, so you can watch five seats fill, one per party.
PR-RCV Is One-Party Compatible
PR-RCV is compatible with One-Party, and No-Party Systems as it pays attention to Individuals, not Factions.
PR-RCV Protects Against Disunity in One-Party States
The ability for voters to cross faction lines ensures no faction can get so much power as to lead to disunity among the general population.
PR-RCV Empowers Local Leadership in One-Party States
In systems with only one faction or no faction, the ability for locals to choose specific individuals brings experience and insight not available to distant centralized party leadership.
Closed Party List systems
Candidates are pre-approved by the party or there is a separate exclusive Primary system before the election. The voters cannot select their candidates.
Semi-Open Party List systems
the Party/Faction leaders are still substituting their will for the will of the voters in most cases. Voters can attempt to override party leadership by achieving a higher threshold.
Open Party List Systems
Voters can have more control over direct candidate selection. However, this occurs within the party list itself. Crossing preferences into other party candidates and independent candidates is still near impossible and impractical.
The Answer
The Results, Compared
Same voters, four systems, four very different outcomes. Here is how each one actually ended.
The Same Voters, Four Outcomes
Each system was run on the identical electorate. Below, the final outcome of each — and how far it drifts from the voters’ actual preferences.
Autocratic Voting
| Candidate | Faction | Count | Vote Share |
|---|---|---|---|
| A | 🟥 Red | 50,000 | 5% |
| B | 🟧 Orange | 250,000 | 25% |
| D | 🟨 Yellow | 200,000 | 20% |
| F | 🟩 Green | 120,000 | 12% |
| G | 🟦 Blue | 300,000 | 30% |
| J | 🟪 Purple | 80,000 | 8% |
Plurality Voting (FPTP)
| Candidate | Faction | Count | Vote Share |
|---|---|---|---|
| A | 🟥 Red | 50,000 | 5% |
| B | 🟧 Orange | 250,000 | 25% |
| D | 🟨 Yellow | 200,000 | 20% |
| F | 🟩 Green | 120,000 | 12% |
| G | 🟦 Blue | 300,000 | 30% |
| J | 🟪 Purple | 80,000 | 8% |
Ranked Choice Voting (RCV)
| Candidate | Faction | Votes | Share |
|---|---|---|---|
| D | 🟨 Yellow | 200,000 | (50%) |
| - F | - 🟩 Green | 110,000 | 11% |
| - J | - 🟪 Purple | 10,000 | 1% |
| - B | - 🟧 Orange | 160,000 | 16% |
| - A | - 🟥 Red | 20,000 | 2% |
| G | 🟦 Blue | 300,000 | (39%) |
| - J | - 🟪 Purple | 30,000 | 3% |
| - B | - 🟧 Orange | 50,000 | 5% |
| - A | - 🟥 Red | 10,000 | 1% |
| - | Dropped | 110,000 | 11% |
Proportional Ranked Choice Voting (PR-RCV)
| Candidate | Faction | Count | Share |
|---|---|---|---|
| B | 🟧 Orange | 170,000 | (20%) |
| A | - 🟥 Red | 30,000 | 3% |
| D | 🟨 Yellow | 110,000 | (20%) |
| E | - 🟨 Yellow | 90,000 | 9% |
| F | 🟩 Green | 120,000 | (20%) |
| C | - 🟧 Orange | 70,000 | 7% |
| A | - 🟥 Red | 10,000 | 1% |
| G | 🟦 Blue | 200,000 | (20%) |
| J | 🟪 Purple | 80,000 | (15%) |
| I | - 🟦 Blue | 20,000 | 2% |
| G | - 🟦 Blue | 40,000 | 4% |
| H | - 🟦 Blue | 10,000 | 1% |
| · | Dropped | 50,000 | 5% |
The Result
Proportional Ranked Choice Voting
No other system comes close to having the final outcome match the voters’ interests. Across the whole simulation, only PR-RCV seats parties in step with how people actually voted.
At a Glance
Who Ends Up in Control
The final seat-control picture for all four systems, side by side.
Autocratic Voting
One faction rules — every rival is erased.
Who Controls
Candidate F controls the seat.
Plurality Voting (FPTP)
The front-runner alone takes all the power.
Who Controls
Candidate G controls the seat.
Ranked Choice Voting (RCV)
Still one winner, but backed by a majority.
Who Controls
Candidate D controls the seat.
Proportional Ranked Choice Voting (PR-RCV)
Power shared across many factions at once.
Who Controls
Several candidates share the seats.
Why It Wins
Why Proportional RCV Wins
Only proportional ranked choice keeps the final outcome matching the voters' interests. Here is what that unlocks.
Protects Diversity
Because seats are awarded in proportion to the vote, every political group holds a share of power at all times — not just whoever narrowly won the last election. Minority voices stay represented instead of being erased between cycles.
Breaks Deadlocks
Two-party systems built on First Past the Post tend to lock into gridlock, each side able to block the other. Proportional representation opens the floor to more parties, so shifting coalitions can form and actually move legislation forward.
Enhances Efficiency
In one-party and no-party states, autocratic incentives reward loyalty over results and let problems fester. PR-RCV replaces those incentives with genuine competition, pushing officials to govern effectively to keep their support.
Empowers Party Members
Members no longer have to fall in line behind a single leader to matter. Because several candidates from one party can win, individual members carry real weight and can champion the issues their own communities care about.
Increases Leverage for Legislators
Individual legislators gain the leverage to represent their own jurisdictions rather than simply voting as faction leadership dictates. That independence gives local communities a far stronger voice in national negotiations.
Ensures Neutrality
When no single faction can dominate, the pressure on speakers, chairs, civil officers, and other appointees to take sides falls away. Balanced power lets them stay genuinely neutral and carry out their duties impartially.
Promotes Cooperation
Because a single faction rarely wins an outright majority, governing requires building coalitions and finding common ground. That structural nudge rewards cooperation and negotiation over the winner-take-all combativeness of other systems.
See the Strongest System in Operation
World of Statecraft fills every seat with a proportional ranked count, after an open approval phase that any resident can enter. The code is open source.

Get Involved
Help Us Complete This Vision!
The simulation makes the case: proportional ranked choice keeps every interest represented. Bring your creativity, skills, or resources to the Cosmopolitan Coalition and help make it the standard.