
World of Statecraft · Districting
How the Maps Are Drawn
Two open datasets, one count of where people actually live, and an automatic drafting system that has produced a lawful first-draft map for every jurisdiction on Earth.
Watch the Walkthrough
From Raw Data to a Seated World
A film that follows one country from downloaded files to a finished district map is in production.
Two Open Datasets, Both Free to Reuse
geoBoundaries: Where the Borders Are
An open database of political administrative boundaries for every country, published under a Creative Commons Attribution licence by the geoBoundaries project. It supplies the nesting structure: countries, then provinces, then counties, then municipalities, as deep as each country publishes.
WorldPop: Where the People Are
Gridded population estimates for the whole planet, published under a Creative Commons Attribution licence by WorldPop. It does not depend on any one government's registry, which matters in the many places where the registry is incomplete, contested, or withheld.
Neither dataset is enough alone. Borders without people cannot apportion a single seat. A population grid without borders cannot say which council a person belongs to. The engine combines them: it lays the population grid over the boundary polygons and counts the people inside every jurisdiction, at every level, for the whole planet. The full import is roughly fourteen gigabytes of source data, and the import can be scoped to a single country for a fast first world.
The design rule behind the pipeline is that the same code must run on a Raspberry Pi and on a large server. Work is cut into small resumable pieces with visible progress, so a modest machine finishes the same job in more time, and an interruption costs one piece instead of the whole run.
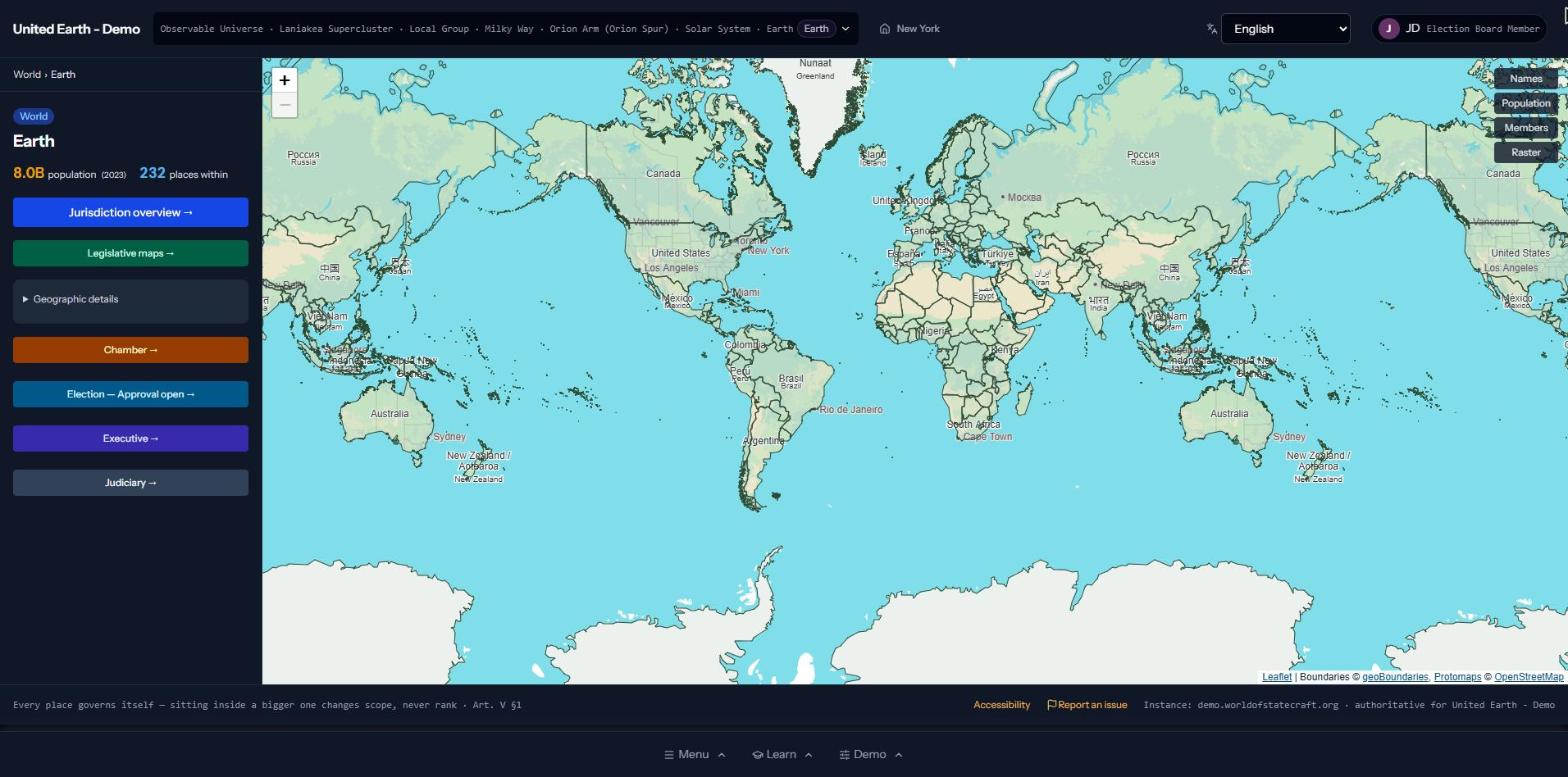
Earth in the live demo, built from geoBoundaries and WorldPop.
The Planet as One Jurisdiction
Earth is the outermost jurisdiction in the demo, with 8.0 billion people and 232 member places. From this one page a visitor can open its chamber, its election, its executive, and its judiciary.
The same page exists for a country, a province, a county, and a town. Sitting inside a bigger place changes the scope of a government, never its rank.
Handling the Noise in Real-World Data
One Shared Grid
Every population file sits on the same global grid. The engine reads each piece of geography once, from every file that covers it, and combines the readings. Where a boundary dataset and a population dataset place a border differently, the people living there are still found and counted.
Nobody Falls Through a Gap
Boundary files leave slivers between neighbors and overlaps along coasts. A populated cell that falls inside no polygon is assigned to the nearest one. A cell claimed by two is divided between them. The total is preserved.
Parts Before Totals
A country's published total rarely equals the sum of its provinces. When seats are shared among members, the engine uses the sum of the members themselves as the base. Shares then always add up, whatever the headline figure says.
Gaps Are Recorded, Not Hidden
Some places have no usable population file, and some are smaller than the grid can resolve. Each anomaly is logged as a flag with a machine-readable reason and queued for review. A problem in one country never stops the rest of the world from being built.
Smoothing would produce cleaner numbers that nobody could verify against the source. The engine takes the opposite approach. It accepts that the inputs are imperfect, and it places the hard guarantees on the outputs: seat totals that are exact, districts within the lawful size band, contiguity wherever it is possible, and a published scorecard for everything else.
From Population to Districts, Automatically
A District Map on Real Geography
Open any legislature and its map shows the districts, the seats in each, and the population behind them. In this capture every district of Poland carries between five and nine seats, and the WorldPop layer shows where people actually live beneath the lines.
Most districts follow borders that communities already know. The map explains itself because its pieces are familiar places. The attribution in the corner names both open datasets.
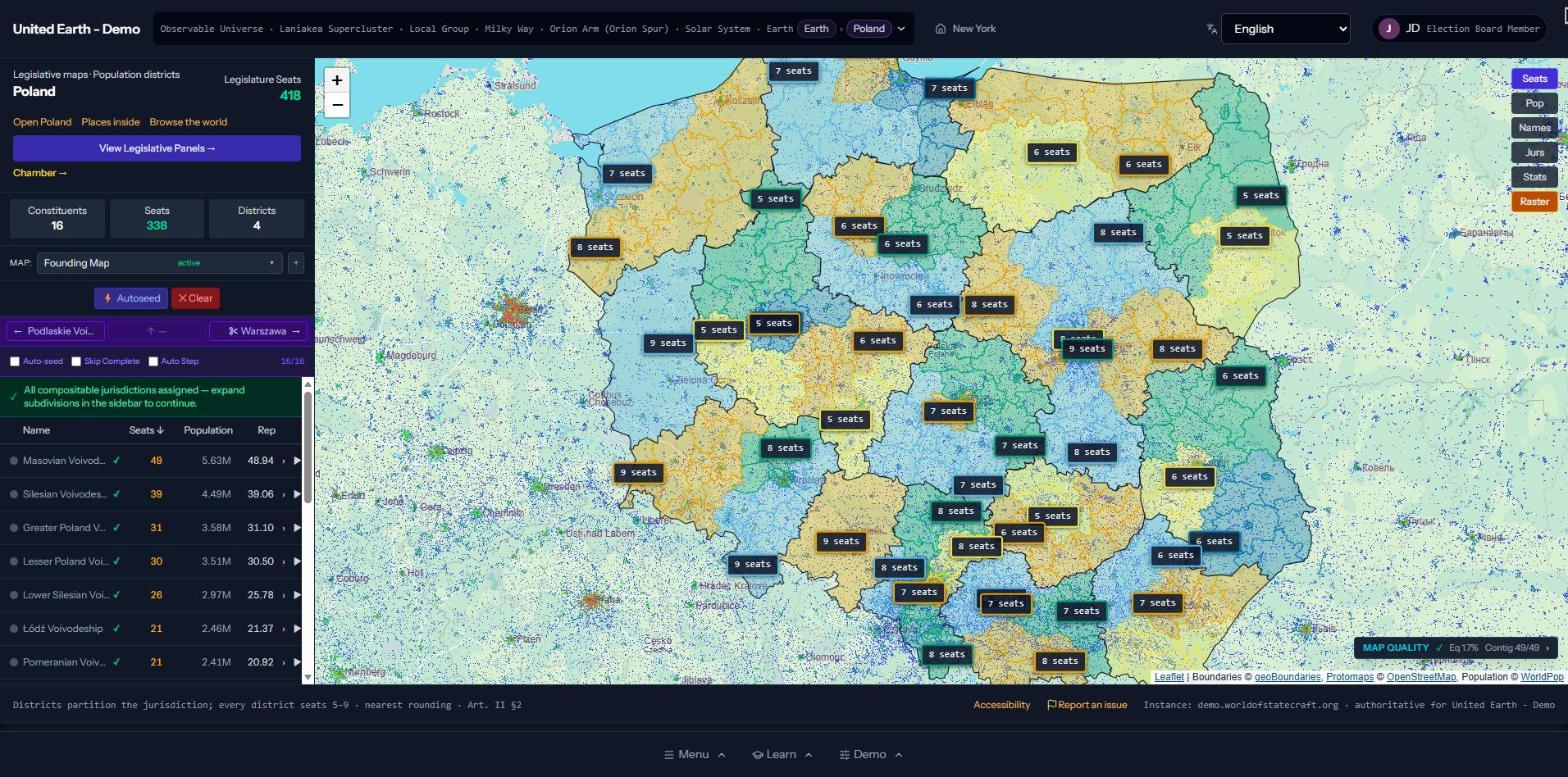
Poland in the live demo: seat labels over the population layer.
A Ladder of Neutral Methods
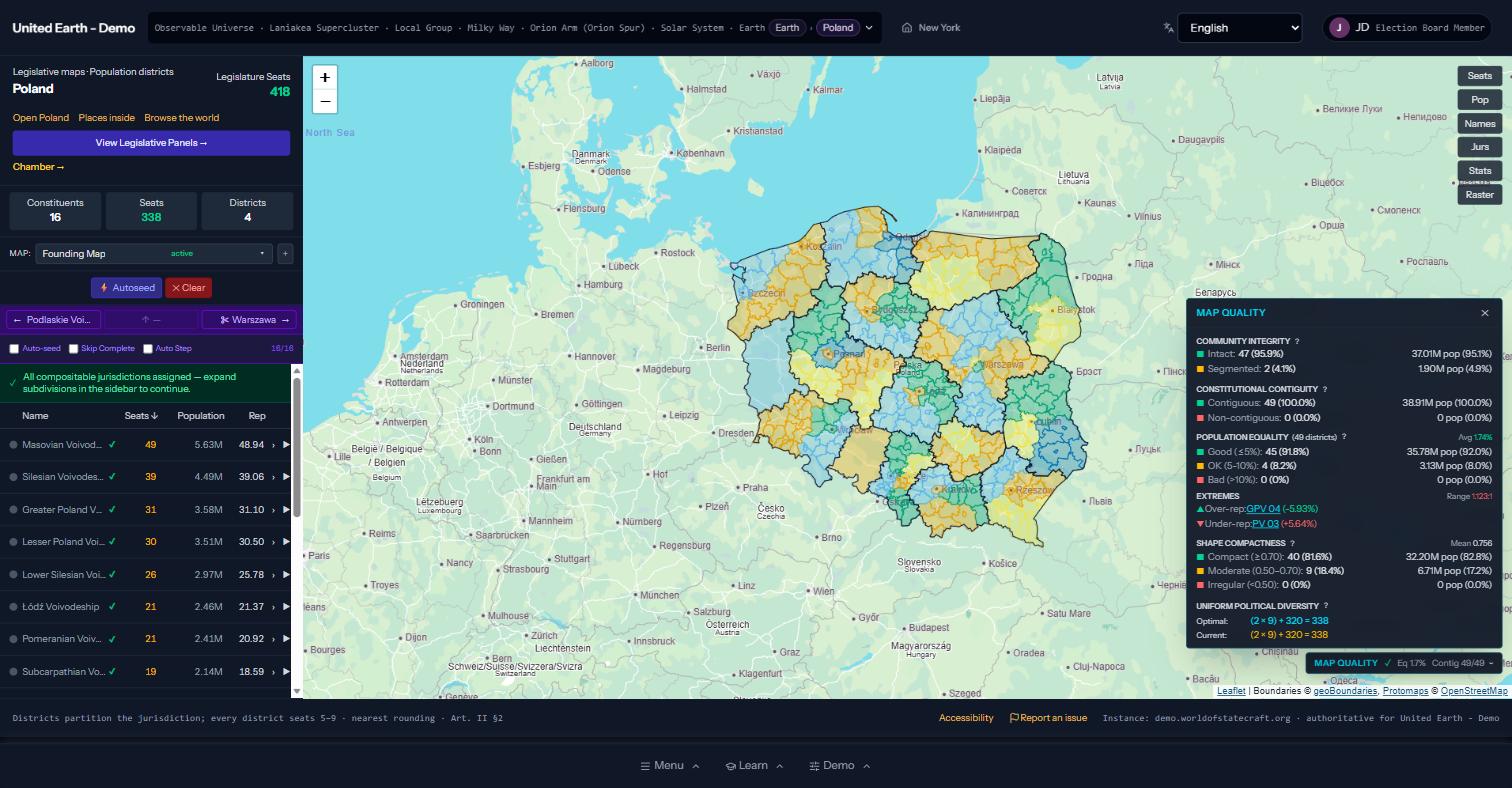
The mapper an election board uses: the active plan, its members, and its scores.
Review, Redraw, or Replace
Drafting is automatic. Adoption is not. Every map is a versioned plan: a draft, an active map, or an archived one. An independent election board can accept the draft, adjust it, or draw its own, and the quality panel scores each attempt the same way.
Earlier versions are never destroyed, so any resident can see what changed and when.
First-draft maps exist for the whole planet, and the demo world is being built from them. They are bootstrap maps: lawful, scored, and ready for a community to adopt or improve. Some unusual shapes remain in a review queue for hand drawing, and they are flagged as such. The software is pre-alpha and the maps should be read as demonstrations, not as official boundaries of any real election.
Open the Maps in the Live Demo
Related Reading
Map Quality Standards
The measurable rules every district map must meet, and the public scorecard each map carries.
Run a Node
Host your own instance on your own hardware, and join a federation with no center.
Legislatures in the Template
Independent election boards and the rule that districts be equal, contiguous, and fair.
Challenges of the Global Community
Why a shared, verifiable picture of the world matters.
Get Involved
Know a Place Better Than the Data Does?
Local knowledge improves every map. If you work with boundary data, population estimates, or electoral geography, help us find where the drafts are wrong.